
Quarter in brief
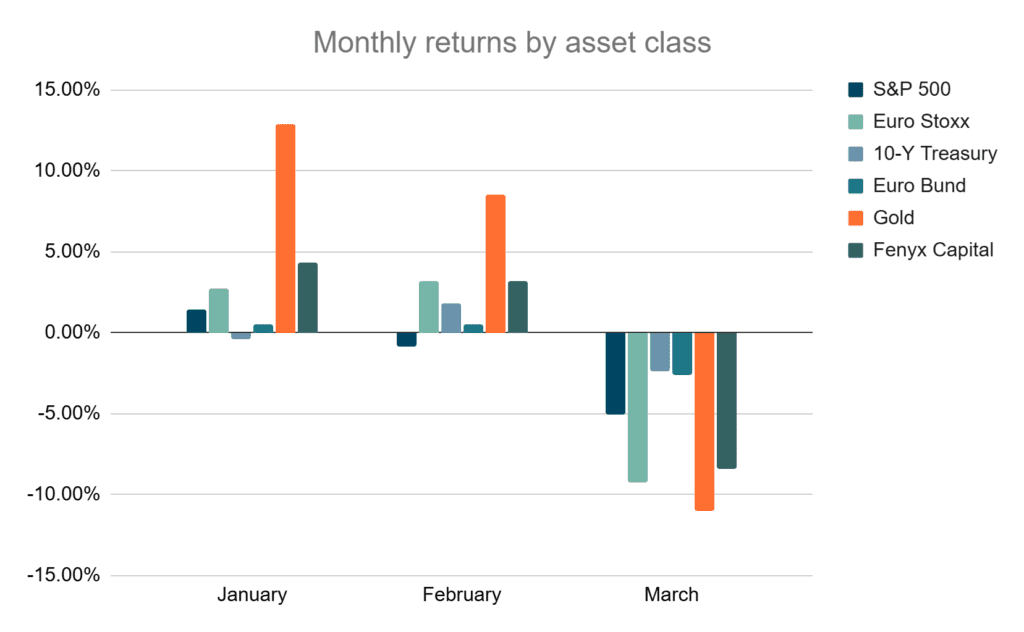
| JAN | Gold surges 12.9%. Equities hold. Fenyx Capital gains 4.3%. |
| FEB | Gold adds 8.5%. European equities advance 3.2% on defence rotation. Fenyx Capital gains 3.2%. |
| MAR | Iran conflict erupts. Gold reverses -11.0%. Equities fall sharply. Fenyx Capital declines 8.4%. |
| S&P 500 | Euro Stoxx | 10-Y Treasury | Euro Bund | Gold | Fenyx Capital |
| -4.6% | -3.8% | -1.1% | -1.7% | +8.9% | -1.4% |
Executive summary
The first quarter of 2026 unfolded in two distinct acts separated by the most consequential geopolitical rupture in the Middle East in a generation. January and February rewarded patience: equities posted modest gains on both sides of the Atlantic, gold surged with remarkable conviction, and our futures strategy delivered 4.3% and 3.2% respectively as investors priced in mounting tension in the Persian Gulf. Then came March. The formal outbreak of war in Iran, and the military escalation that followed, triggered a synchronized liquidation across virtually every asset class, erasing much of what had been built over the preceding two months. U.S. equities closed the quarter down 4.6%, Euro Stoxx declined 3.8%, and gold, despite its spectacular January-February run, surrendered a significant portion of its gains in a violent reversal, ending the quarter up 8.9%. Fenyx Capital finished at -1.4%, a result that, while disappointing in absolute terms, reflected the strategy’s capacity to limit the damage relative to traditional asset classes during March’s severe stress.
The quarter poses a challenge to conventional thinking about portfolio construction: in a genuine shooting war, the correlations that investors rely upon can dissolve without warning.
The calm before
The first two months of 2026 had the character of a market slowly coming to terms with something it preferred not to fully acknowledge. Geopolitical intelligence pointing toward potential military conflict in Iran had been circulating since late 2025, but equity markets, in their characteristic fashion, continued to assign a low probability to the scenario’s most severe outcomes. U.S. equities gained a modest 1.4% in January and edged slightly lower in February (-0.9%), a performance pattern consistent with a market in a holding pattern rather than one exhibiting conviction.
European equities were more buoyant. Euro Stoxx advanced 2.7% in January and 3.2% in February, supported by improving economic data and the European Central Bank’s continued willingness to maintain accommodative conditions relative to its American counterpart. The contrast with U.S. equities was subtle but meaningful: European markets appeared to be pricing economic fundamentals while their American peers were already beginning to discount the possibility of disruption.
The bond markets told a similarly muted story. German Bunds offered quiet positive returns of 0.5% in both January and February. U.S. 10-Year Notes declined 0.4% in January before recovering 1.8% in February, a pattern suggesting that American investors were rotating toward duration as a defensive measure even as equities remained broadly stable. These were not the movements of markets expecting a sharp shock; they were the cautious repositioning of portfolios that sensed, without yet knowing, that something significant was approaching.
Gold’s premonition
Gold did not equivocate. While equities drifted and bonds recalibrated modestly, the precious metal delivered 12.9% in January and 8.5% in February, a cumulative 23.1% gain in just two months. By late February, gold had surpassed $5,000 per ounce, a level that would have seemed extraordinary twelve months earlier when it first broke above $3,000.
The magnitude and consistency of this move deserves careful interpretation. Gold is often described as an inflation hedge, and inflation concerns were still present, with Core PCE in the United States remaining above the Federal Reserve’s target. But a 23% two-month return cannot be explained by inflation expectations alone. The more persuasive reading is that global capital was voting, in real time, on the probability of serious geopolitical disruption; a form of collective political intelligence that equity markets, anchored to earnings models and discount rates, were slower to reflect.
Gold’s January and February performance was not a vote of confidence in the precious metal. It was a vote of no-confidence in everything else.
Central bank demand, particularly from emerging market institutions reducing their dollar exposure, provided structural support. But the pace of January and February’s rally suggests that something beyond institutional rebalancing was at work. Gold was functioning less as an asset class and more as a barometer; registering what more sophisticated participants already suspected about the trajectory of events in the Persian Gulf.
Fenyx Capital performed in line with this environment. January’s 4.3% and February’s 3.2% gains reflected the strategy’s multi-asset architecture, which allowed it to benefit from gold’s strength and fixed income’s modest positive contribution while remaining partially insulated from the softness in U.S. equities.
The March rupture
At the end on February, diplomatic channels collapsed and the conflict in Iran crossed from tension into war. The failure of the Geneva negotiations, the strikes on Iranian nuclear infrastructure, and the subsequent escalation involving Strait of Hormuz shipping lanes, constituted a shock that markets had not fully priced even as gold had been signaling its approach for weeks.
The immediate reaction was textbook crisis behavior: a violent, indiscriminate liquidation. U.S. equities fell 5.1% over the month. Euro Stoxx declined 9.3%, reflecting the continent’s acute vulnerability to energy supply disruption and its greater proximity, both geographic and economic, to the theater of conflict. European manufacturers, already navigating a challenging trade environment, faced the additional threat of elevated energy costs at a moment when margins offered little cushion.
What proved most instructive (and most unsettling for investors who had built their portfolios around conventional diversification logic) was gold’s behavior. The precious metal that had risen nearly 23% in just two months fell 11.0% in March. The parallels to April 2025’s tariff shock are striking: then, as now, an asset with powerful fundamental support became a source of liquidity when leveraged positions across the financial system required collateral. Forced selling is indifferent to fundamentals. When margin calls cascade, investors liquidate what they can, not what they wish they could.
The dynamics underlying gold’s March decline illuminate a critical limitation in the safe-haven framework. Precious metals protect portfolios during periods of slow-moving uncertainty; they are less reliable when the crisis becomes acute enough to trigger systemic margin pressure. This is not a new phenomenon (it was observed in March 2020 and, as noted, in April 2025), but it is one that many allocation frameworks continue to underweight.
Fixed income offered little refuge. U.S. 10-Year Notes fell 2.4% in March, bringing their quarterly total to -1.1%. German Bunds declined 2.6%, ending Q1 down 1.7%. The simultaneous pressure on both equities and sovereign bonds reflects an environment where a geopolitical shock carries inflationary implications (oil prices spiked sharply on Strait of Hormuz concerns) that constrain the policy tools central banks would ordinarily deploy. The Federal Reserve and the ECB found themselves in a position familiar from 2025: unable to ride to the rescue without risking a further deterioration in already elevated inflation expectations.
Our futures strategy declined 8.4% in March. This represents a meaningful drawdown, and honesty requires acknowledging it as such. The strategy’s adaptive mechanisms, designed to reduce exposure during periods of rising volatility, were partially effective but could not fully anticipate the speed of a geopolitical shock that materialized within days rather than weeks. For the quarter, Fenyx finished at -1.4%, a result that compares favorably to the -4.6% and -3.8% posted by U.S. and European equities respectively, but one that offers limited comfort to investors who observed the February highwater mark.
The oil variable and inflation’s persistence
No analysis of Q1 2026 can avoid the question of oil. The Strait of Hormuz, through which roughly 20% of global petroleum trade flows, became the focal point of March’s anxiety. While a full blockade did not materialize, the credible threat of disruption was sufficient to push Brent crude to levels not seen since the post-pandemic recovery. This energy price shock arrived at a moment of particular inconvenience for monetary policymakers.
The Federal Reserve had, entering 2026, been carefully managing expectations around a gradual easing cycle. The Iran conflict complicated this narrative decisively. An oil-driven inflation spike, even if temporary, makes it politically and institutionally difficult to cut rates. The bond market’s reaction in March (prices falling, yields rising) reflected precisely this reassessment: investors were pricing a Fed that would be constrained by inflation even as growth prospects deteriorated. This stagflationary dynamic, familiar from the 1970s and briefly revisited in 2022, is perhaps the most challenging environment for traditional asset allocation.
In Europe, the challenge was compounded by the continent’s structural energy dependency. The ECB’s room to maneuver, already circumscribed by southern European fiscal positions, narrowed further as energy costs pressured both headline inflation and corporate margins simultaneously. The 9.3% decline in Euro Stoxx in March was not merely a reaction to geopolitical risk in the abstract; it was a market recalibrating earnings expectations in an environment where energy input costs could remain elevated for an extended period.
What the quarter reveals about portfolio construction
The events of Q1 2026 invite a more fundamental examination of how diversification functions when correlations converge. The standard prescription (a blend of equities, fixed income, and real assets such as gold) performed well in January and February and failed in March. Not because the underlying logic was wrong, but because a sufficiently acute shock can simultaneously impair the performance of assets whose decorrelation is assumed rather than structural.
This is not an argument against diversification. A portfolio concentrated in European equities alone would have suffered a 3.8% quarterly loss that would have felt far worse in real time, given March’s 9.3% drawdown. The presence of gold, even after its March reversal, contributed meaningfully to a better outcome than single-asset exposure would have provided. The question worth asking is whether the risk management framework adequately accounts for what might be called correlation collapse: the tendency of diversification benefits to disappear precisely when they are most needed.
The performance divergence between U.S. and European equities (a 1.5 percentage point gap over the quarter that masks a more dramatic spread in March) suggests that geographic diversification carries its own asymmetries. American equities showed greater resilience partly because the U.S. economy’s energy self-sufficiency, bolstered by the shale revolution, insulates it to a degree from petroleum supply shocks that European markets cannot match. The allocation implications of this structural difference merit continued attention as the Iran situation evolves.
The road ahead
The conflict in Iran remains unresolved as this report is written. A negotiated ceasefire is possible; an extended military engagement is equally conceivable. What is certain is that the geopolitical backdrop has shifted in ways that are unlikely to reverse quickly even if hostilities abate. The risk premium now embedded in energy markets, sovereign credit spreads in the region, and global equity valuations will not dissolve with a single diplomatic announcement. History suggests that the markets recover, as they demonstrated after every major geopolitical shock from the Gulf War to the post-pandemic reopening. The pace and character of that recovery will depend on whether the Iran conflict is contained or whether it draws in additional state and non-state actors.
For thoughtful investors, the lesson of Q1 2026 may be less about specific asset class performance and more about the importance of liquidity management during periods of acute stress. The capacity to avoid forced selling (to be the buyer rather than the seller when correlations collapse and prices overshoot) is one of the most underappreciated sources of long-term return. It requires holding more cash than feels productive during calm periods and maintaining the discipline to deploy it when conditions are at their most alarming.
Gold’s quarterly return of 8.9%, achieved through a volatile path, continues to validate its role in a diversified portfolio even if its behavior in March was a reminder that no asset is immune to systemic stress. The metal’s underlying drivers (persistent inflation, central bank demand, sovereign currency uncertainty, and now acute geopolitical disruption) remain intact. The question for the coming quarters is not whether gold has a role to play, but how investors manage the volatility that comes with it.
The broader strategic picture remains one in which patience and flexibility matter more than conviction in any single directional view. The quarter that just ended is a powerful reminder that the most consequential developments rarely announce themselves politely. They arrive, as they did in March, all at once.
Contact us for a more detailed financial report of our futures strategy.
Disclaimer: This article is for informational purposes only and does not constitute investment advice. Investors should conduct their own due diligence or consult with a financial advisor before making any investment decisions.
Photo by Job Vermeulen on Unsplash.
